- Thermal Properties Of Materials
- Thermal Conductivity Of Metals

Thermal Conductivity of Metals

During winter, walking on the living room tiles feels much colder than walking on the carpet. Isn’t this a little surprising, considering both titles and the carpet are at the same temperature? The different sensations felt by us are explained by the fact that different materials conduct heat at different rates. In this case, the tile conducts heat faster than the carpet, so the tile transfers heat out of your foot faster than the carpet. This property also explains why it is better to stir the soup with a wooden spoon and roast marshmallows with a wooden stick. It is because metallic objects can conduct heat very quickly. Of all metals, silver has the highest electrical conductivity. Let us quickly perform an experiment to find out the metal having the highest conductivity from a set of metals.
Thermal Conductivity of Metal Rod Experiment
The purpose of this experiment is to describe the effect that varying thermal conductivities have on the heat flow through a given material. Ultimately, this will give a better knowledge of both thermal conductivity and thermal resistance.
To determine which metal is the best conductor of heat.
Apparatus Required
- At least 12 inches long metal rod that can be made up of either steel, brass or copper. Make sure that every wire has the same thickness.
- A burner to boil the water.
- Four digital thermometers
- Fill a large container with water and ice cubes and allow the water to cool for an hour.
- Bend all the metal rods in half to develop metal bridges.

Metal bridge experiment
- Keep the cups in pairs, and the three bridges of the same metal exist between every cup. One pair of cup do not have bridges, and this is the control group.
- Place an instant digital thermometer in every cup that contains cold water.
- Pour an equal volume of hot water into each pair of cups and make sure that the water covers the ends of the bridges.
- Pour an equal amount of cold water into the other cups of each pair and make sure that the water covers the ends of the bridges.
- Note the initial temperatures of the cold water in a chart and list the time and temperature in degrees.
- Note the temperature of the cold water cup every 5 minutes for 30 minutes. The table needs to have the set(copper, steel), time and temperature.
- Calculate which cup undergoes the greatest change in temperature by subtracting the container’s initial and final temperature.
- Organise the data on a line graph. Plot time on the x-axis and temperature on the y-axis. You can notice the conductivity of each metal. The steeper the slope, the higher the conductivity.
Copper transfers maximum heat and is followed by brass. Steel is the least conductor of heat. The conductivity of heat is the major property of an object, and copper has the highest and steel has the lowest conductivity of heat among the given set of metals. Check out more such experiments by clicking on the links provided below:
Stay tuned to BYJU’S to learn more physics-related concepts, experiments and more.
Frequently Asked Questions – FAQs
Define thermal conductivity., what is the formula to find thermal conductivity.
Thermal conductivity is given by the formula: \(\begin{array}{l}k=\frac{QL}{A\Delta T}\end{array} \)
State true or false: Steel is the least conductor of heat.
What is the si unit of thermal conductivity, what are the means of heat transfer.

Put your understanding of this concept to test by answering a few MCQs. Click ‘Start Quiz’ to begin!
Select the correct answer and click on the “Finish” button Check your score and answers at the end of the quiz
Visit BYJU’S for all Physics related queries and study materials
Your result is as below
Request OTP on Voice Call
Leave a Comment Cancel reply
Your Mobile number and Email id will not be published. Required fields are marked *
Post My Comment
Register with BYJU'S & Download Free PDFs
Register with byju's & watch live videos.
- Gases and liquids
- Structure of matter
- Atomic models
- Chemical bonds
- Structure of metals
- Ductility of metals
- Solidification of metals
- Steelmaking
- Iron-carbon phase diagram
- Heat treatment of steels
- Material testing
- Planetary gear
- Involute gear
- Cycloidal gear
- Temperature
- Kinetic theory of gases
- Thermodynamic processes in closed systems
- Thermodynamic processes in open systems
- Geometrical optics

- Thermodynamics
Experimental setup for determining thermal conductivity
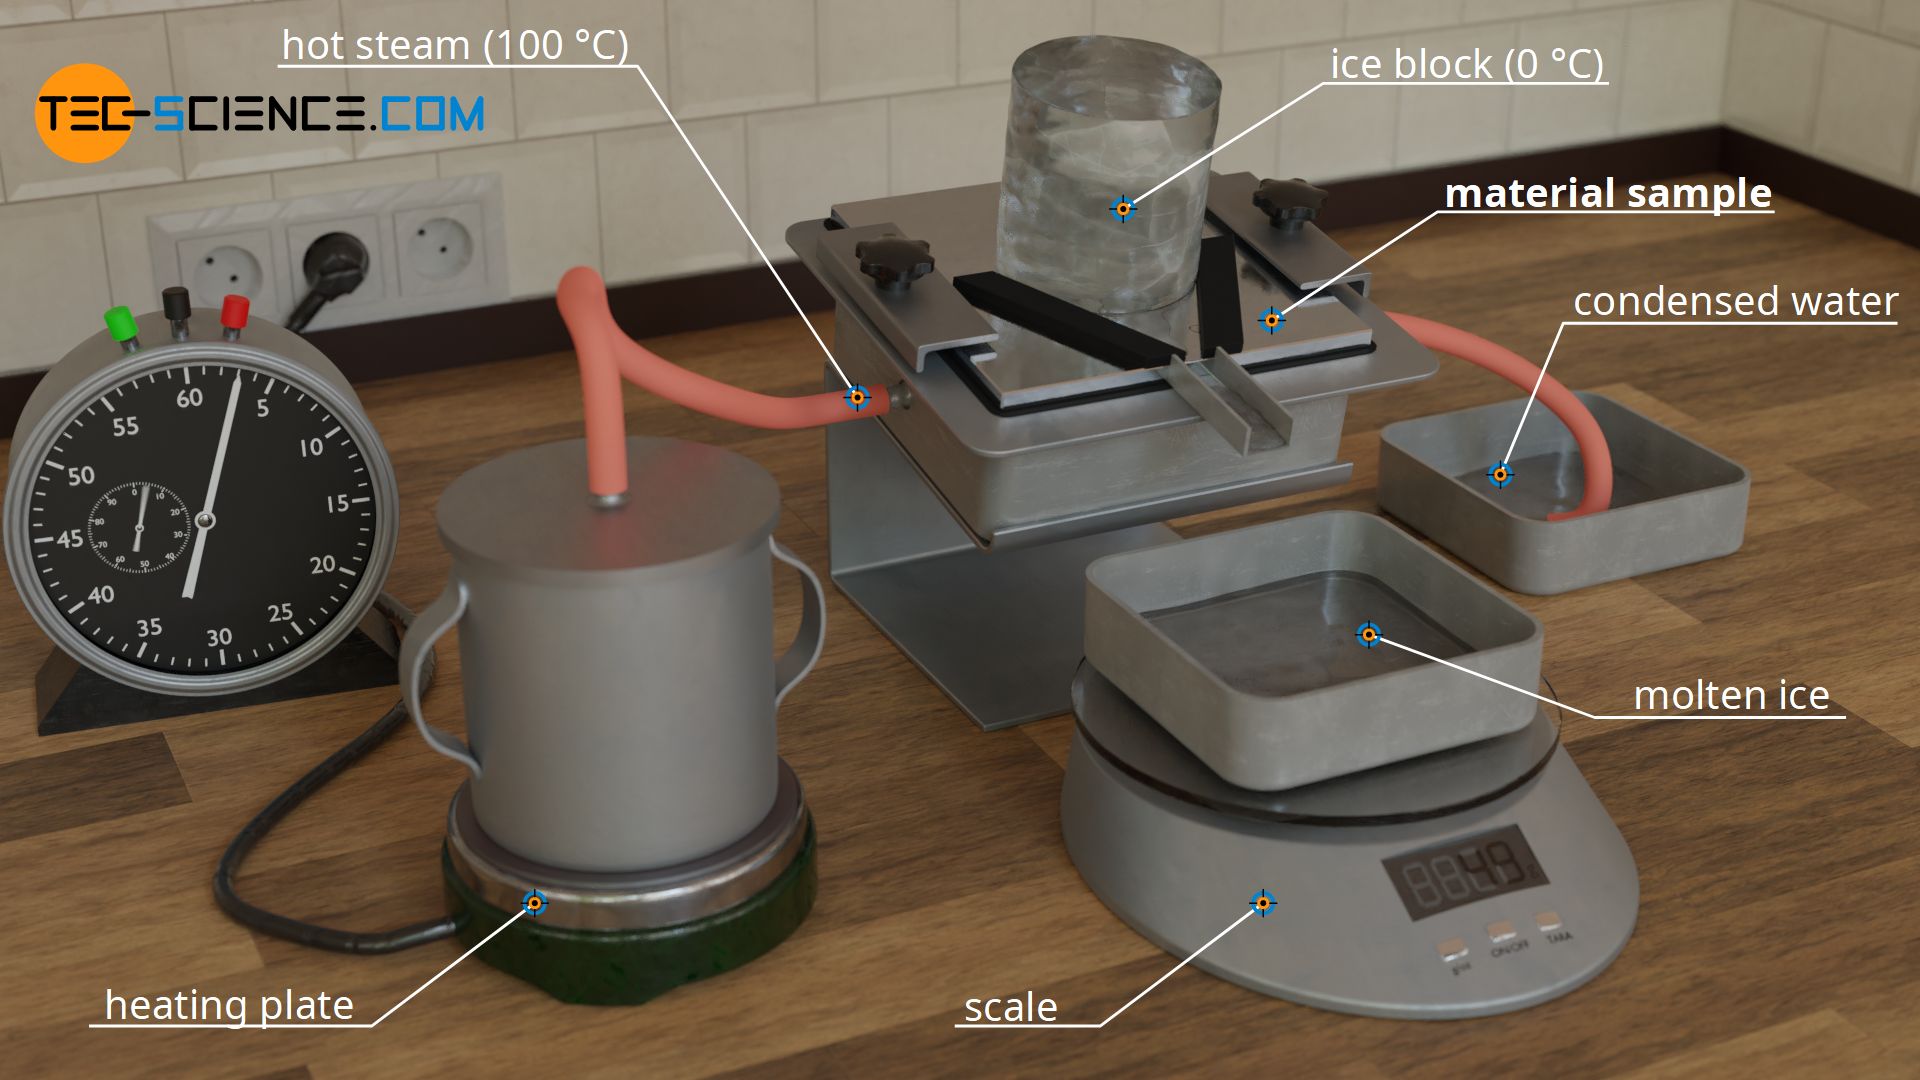
In this article you can learn more about the experimental determination of the thermal conductivity of materials using steam and ice.
Thermal conductivity
Thermal conductivity is a measure of how well or poorly a material conducts heat. The thermal conductivity λ describes the relationship between a temperature gradient ΔT along a distance Δx and the resulting rate of heat flow Q* through the area A:
\begin{align} &\boxed{\dot Q =\lambda \cdot A \cdot \frac{\Delta T}{\Delta x}} ~~~~~\text{and}~~~~~[\lambda]=\frac{\text{W}}{\text{m} \cdot \text{K}} ~~~~~\text{thermal conductivity}\\[5px] \end{align}
Detailed information about this equation, also known as Fourier’s law, can be found in the article on Thermal conductivity . In this article we will only focus on the experimental determination of thermal conductivity, which is based on the equation above:
\begin{align} \label{a} &\boxed{\lambda =\frac{\dot Q \cdot \Delta x}{\Delta T \cdot A}} \end{align}
In order to determine the thermal conductivity λ of a material with a thickness Δx and an area A, a temperature difference ΔT must first be applied and the resulting heat flow rate Q* must be determined.
Principle of measurement
In the following a relatively simple experiment will be presented with which the thermal conductivity of a material sample can be determined.
For this purpose, a slab-shaped sample is used, for whose material the thermal conductivity is to be determined. In the case shown, it is a metal plate. This metal plate has the thickness Δx = 10 mm and is heated from one side and cooled from the other. The figures below show the experimental setup.

Heating is done with hot steam, which generates a temperature of exactly 100 °C when condensing on the plate. For temperature control of the cold side, a block of ice is used, which creates a temperature of exactly 0 °C on the plate during melting. This results in a temperature drop of ΔT = 100 °C along the thickness of the plate.
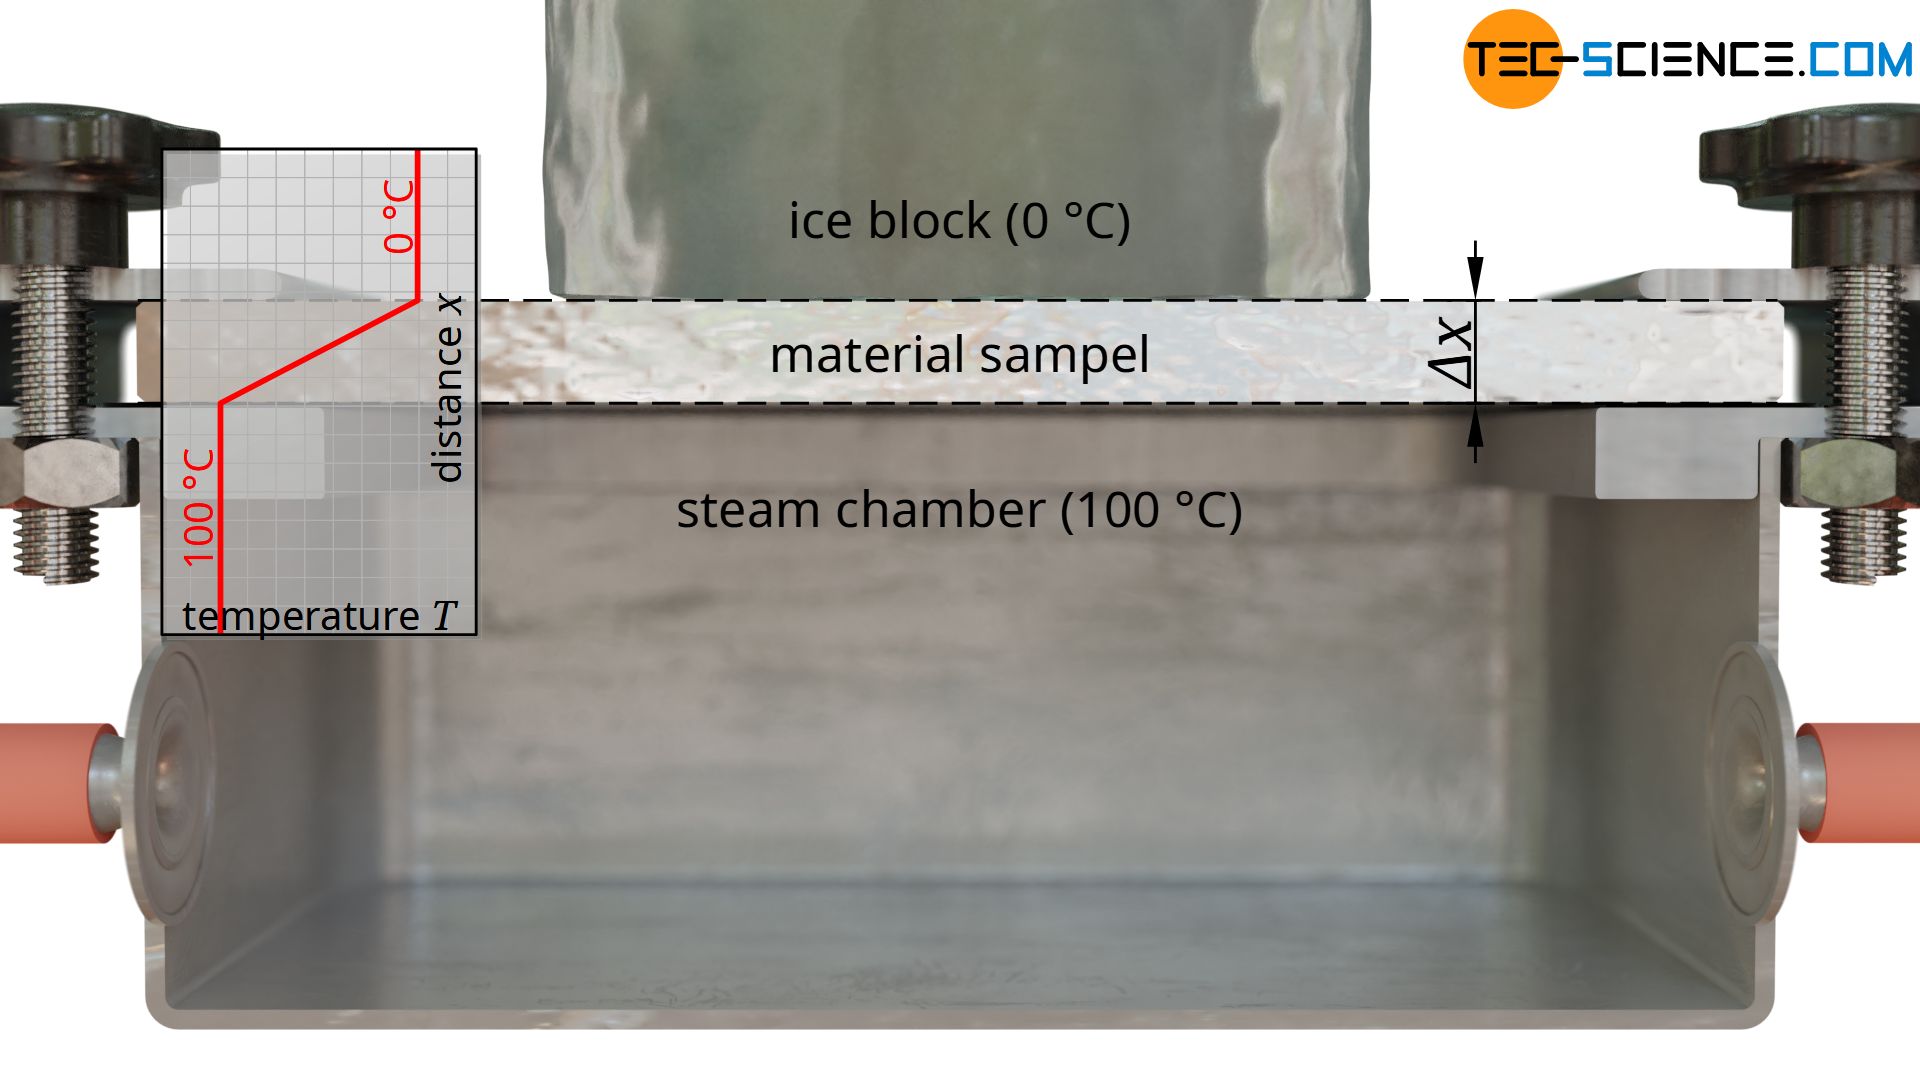
The rate of heat flow is determined by the amount of melted water. For this purpose, the melted water within a certain time is collected and weighed. Using the specific heat of fusion of the ice of q f =334 kJ/kg and the melted water mass m within the time Δt, the heat flow rate Q* through the sample plate is determined as follows:
\begin{align} &\dot Q=\frac{Q}{\Delta t} = \frac{q_s \cdot m}{\Delta t} \end{align}
If, for example, an ice mass of m = 50 g melts within the time Δt = 17 s, then according to the upper formula a heat flow rate of Q* = 982 J/s results.
However, the timing and collection of the melted water must not be started immediately after the ice block has been put on the specimen. First of all, a steady state must be established, i.e. you have to wait some time until the temperatures in the material do not change any more and a temperature gradient that is constant over time has been established. The thermal conductivity only refers to such steady states where the rate of heat flow is constant in time. The change of temperature while the sample is still warming up, however, is described by the so-called thermal diffusivity (although both quantities are linked together). This temperature propagation is a so-called unsteady state in which the rate of heat flow is not constant in time. In the simulation below the steady state is reached after about 10 seconds.
As a further quantity for calculating the thermal conductivity, the area A through which the heat flow passes is also required. This corresponds to the contact surface of the ice block. Note: Not the entire surface of the plate may be used as a basis, since the heat flow relevant for melting the ice block only passes through the area where the ice block is located. The heat flows outside of this area, which are considered one-dimensional, are transferred to the air and are not taken into account by the melting process (more about this later).
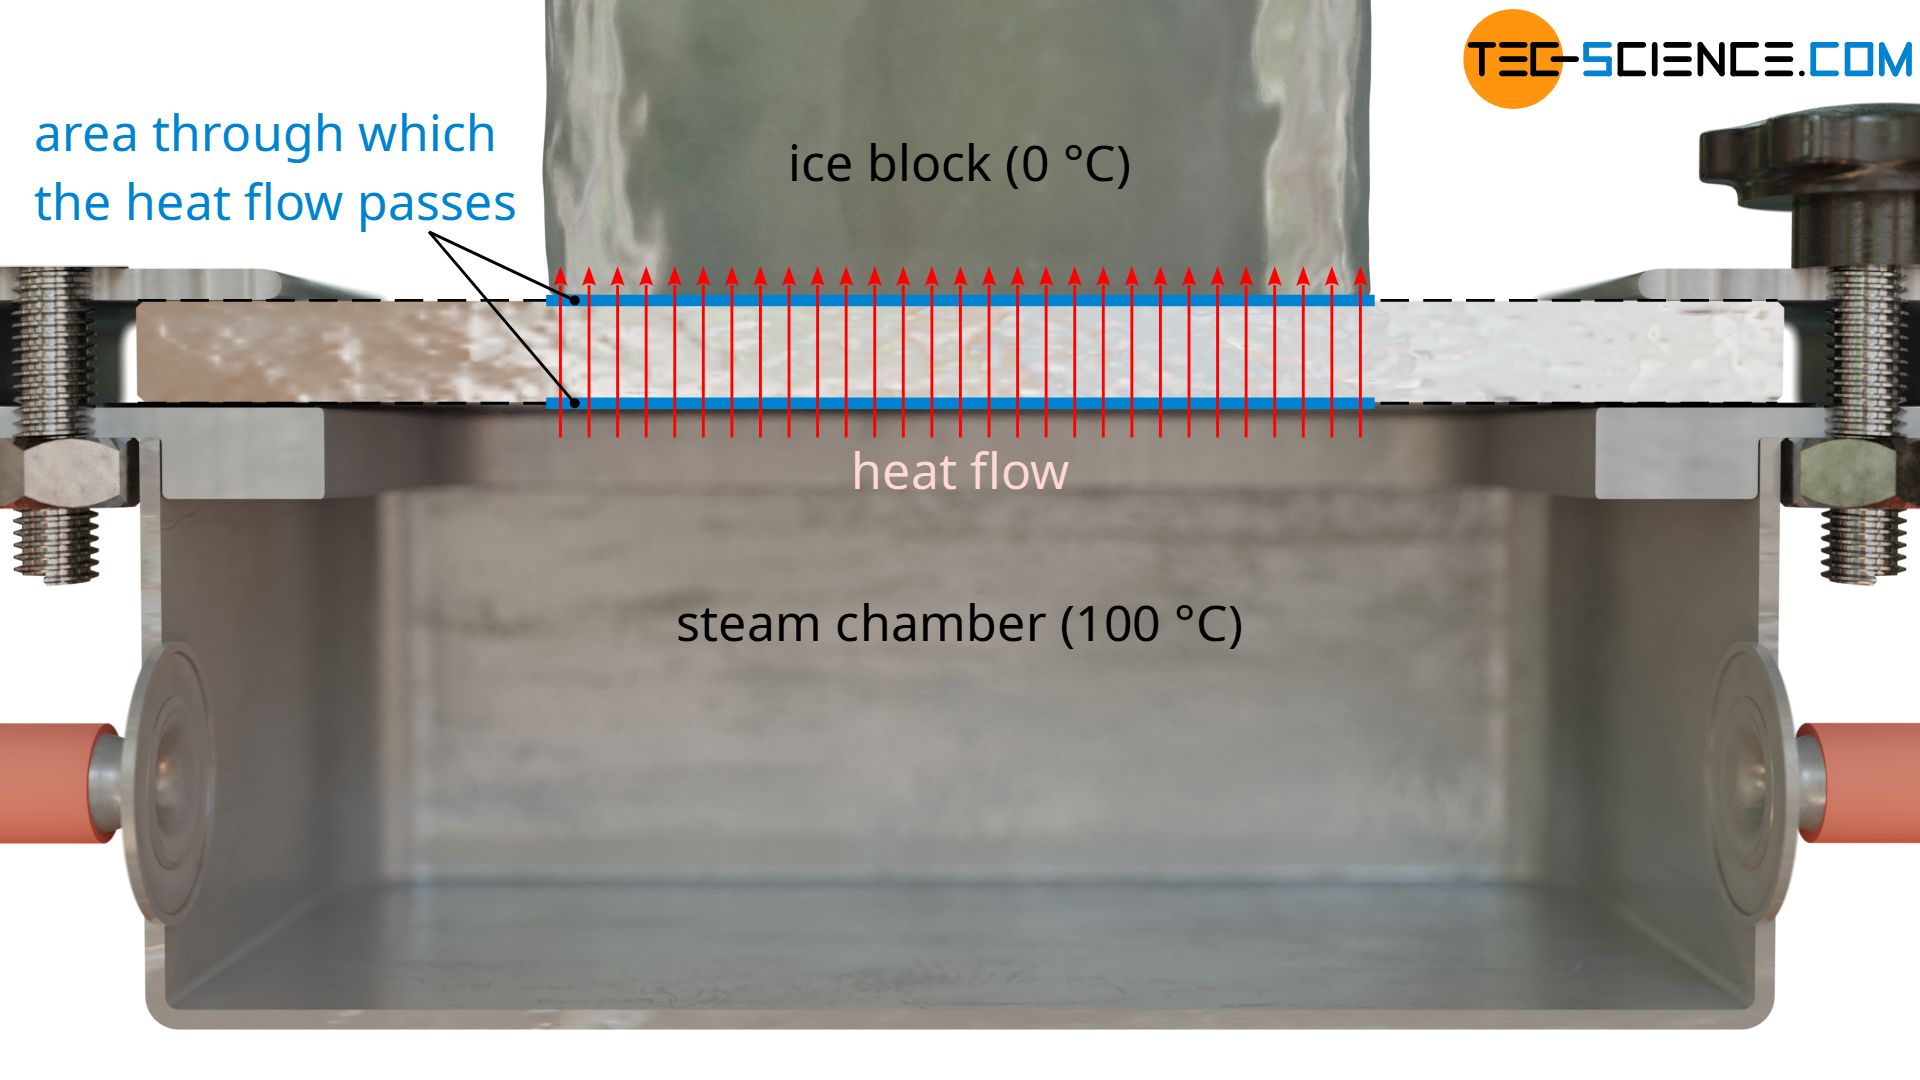
With a diameter of the ice block of e.g. 5 cm, this results in a area of A = 0.00196 m².
Now that all relevant parameters have been determined (sample thickness, temperature drop, area and heat flow rate), the thermal conductivity of the material sample used can finally be determined according to equation (\ref{a}). With these given values one obtains a thermal conductivity of λ= 50 W/(m⋅K).
\begin{align} &\lambda =\frac{\dot Q \cdot \Delta x}{\Delta T \cdot A} = \frac{982 \frac{\text{J}}{\text{s}} \cdot 0.01 \text{ m}}{100 \text{ K} \cdot 0.00196 \text{ m²}} = 50 \frac{\text{W}}{\text{m}\cdot \text{K}} \end{align}
Cons of this experimental setup
No pure thermal conduction.
When determining thermal conductivity experimentally, it should be noted that thermal conductivity by definition only refers to heat transfer by thermal conduction , not convection or radiation ! In the case of materials containing gases (e.g. autoclaved aerated concrete), however, thermal convection in the gas pores cannot be avoided. Heat radiation can also penetrate the material under certain circumstances. These heat transfer mechanisms are (unintentionally) taken into account in the experimental determination of thermal conductivity. However, the influence of thermal radiation can be minimized if the sample is as thick as possible so that radiation hardly penetrates the sample. However, this has another disadvantage, as will be shown in a moment.
No one-dimensional heat flow
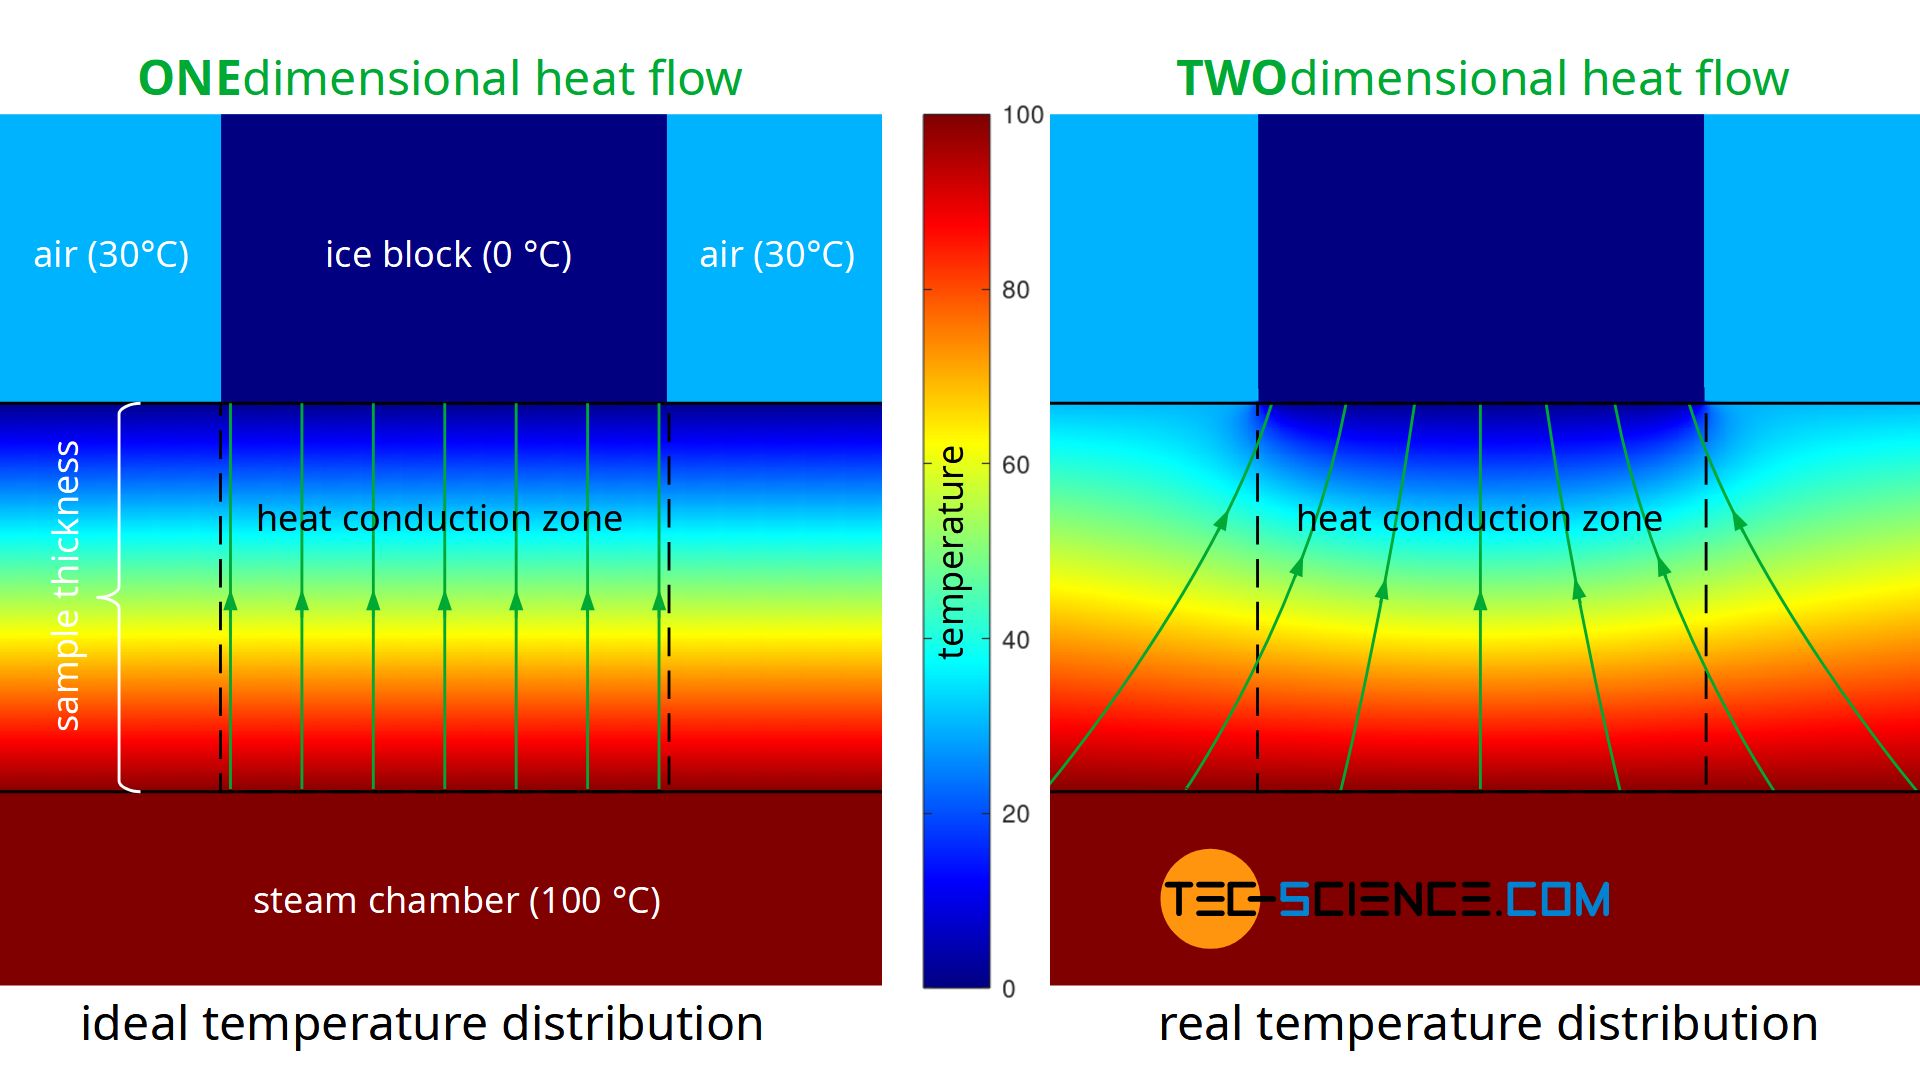
A further disadvantage of the experiment described is that during the performance of the experiment there is no one-dimensional heat flow through the material, as Fourier’s law requires on a macroscopic scale. Heat, so to speak, does not flow straight through the sample, but also enters the heat conduction zone (measuring zone) laterally. The heat flow is therefore based on a larger surface area on the hot underside of the sample than on the upper side where the ice block is located (see figure below). This effect of the two-dimensional heat flow has less influence on the result, the thinner the sample material is in comparison to the surface. At the same time, however, the influence of thermal radiation increases, since this penetrates thin samples more strongly than thick ones.
The figure below shows the simplified simulation of the temperature distribution and thus the heat flow. Modelling was done with a constant temperature at the bottom of the plate and constant temperatures at the top. The temperatures towards the ice block and towards the environment were assumed to be sharply limited. The simulation shows the formation of a two-dimensional heat flow as it occurs in reality. In comparison, the figure also shows a one-dimensional heat flow as it is actually required for the Fourier’s law to be valid.
Temperature dependence of thermal conductivity
Another disadvantage of the described method refers to the adjustment of the temperatures. Strictly speaking, the thermal conductivity is not a material constant, but depends on the temperature. The method therefore only measures an average thermal conductivity in the range between 0 °C and 100 °C. A more detailed investigation of the thermal conductivity as a function of temperature is not possible with such a experimental setup. The temperatures are fixed when using steam and ice and cannot be changed.
Generating one-dimensional heat flows
For the determination of the thermal conductivity according to equation (\ref{a}) to be valid at all, a one-dimensional heat flow must be ensured. This can be achieved, for example, by controlling the temperature outside the actual heat conduction zone (measuring zone). The temperature is chosen identically to the temperature of the cooled side. Therefore the sample plate around the ice block is also brought to a temperature of 0 °C.
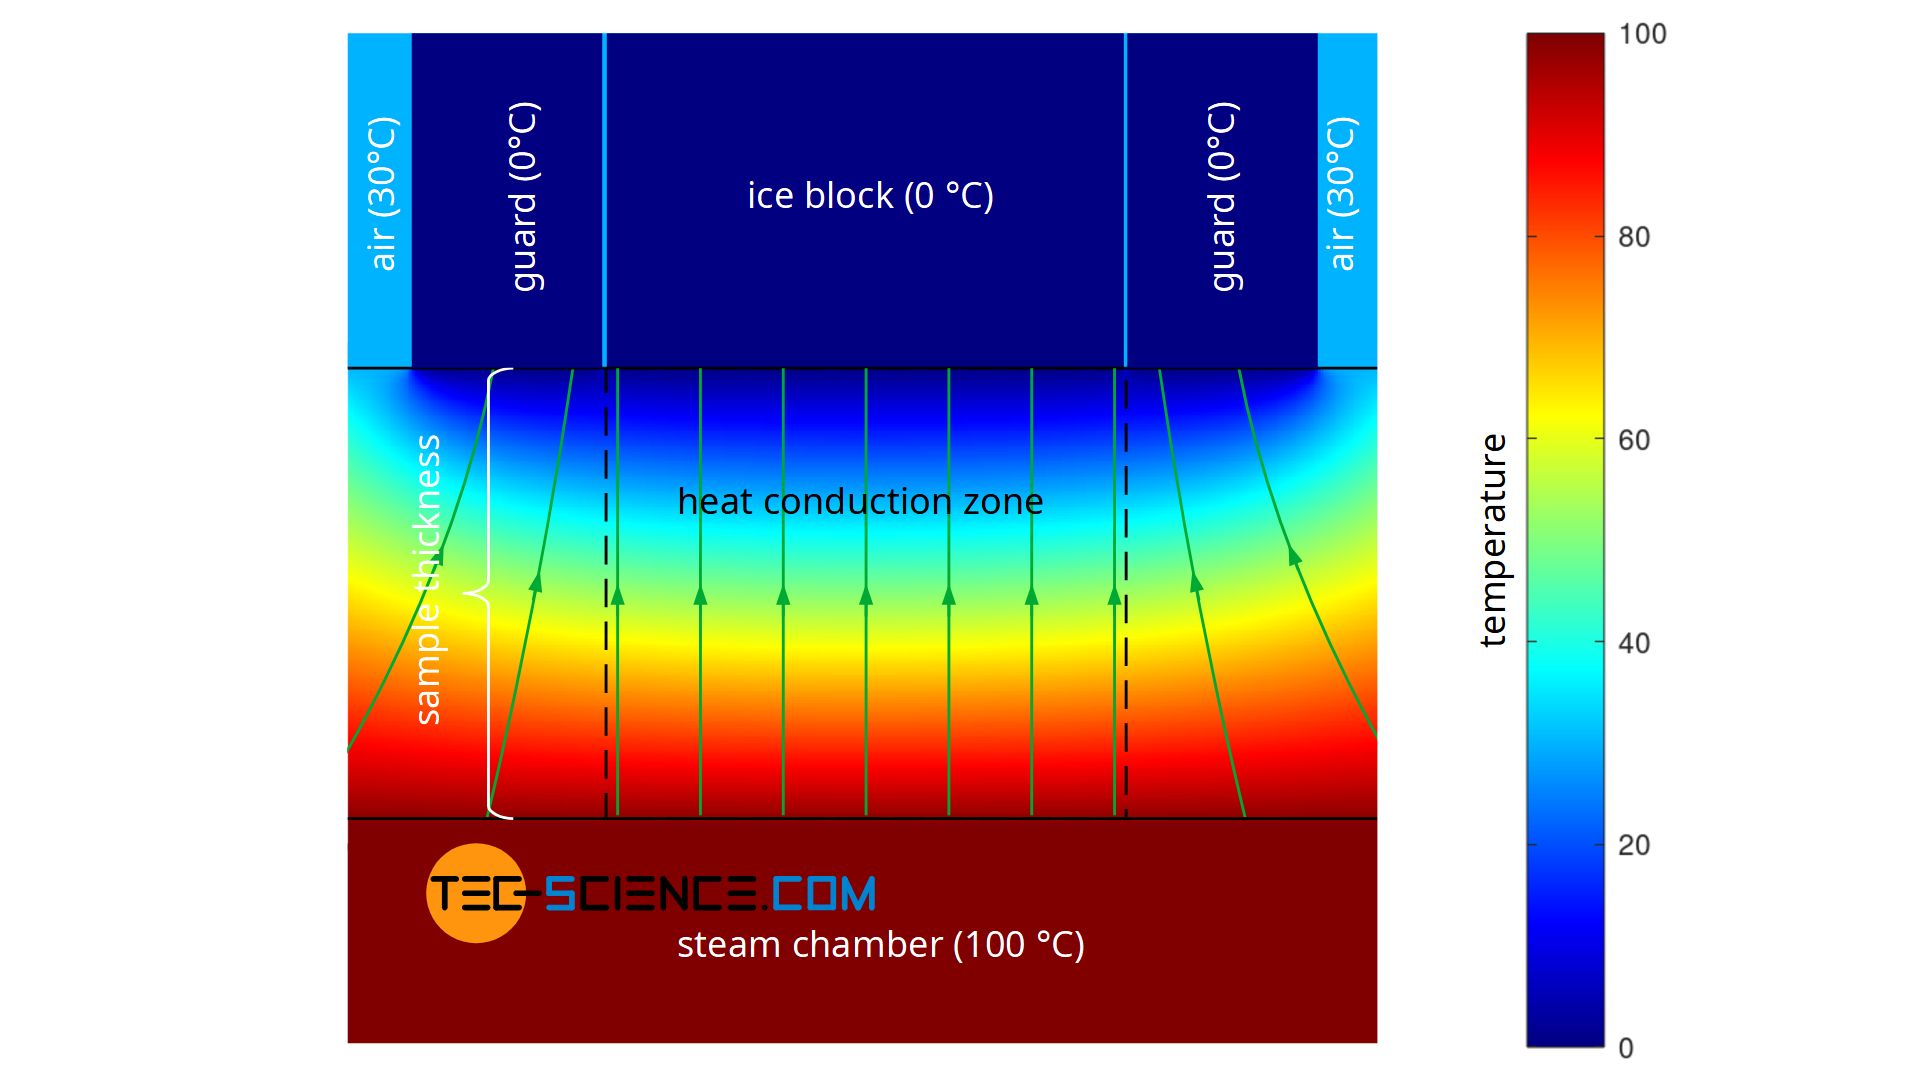
Of course, a ring of ice cannot be used here, because it would also melt and thus be taken into account in the calculation of the thermal conductivity. This would only have enlarged the original ice block. The two-dimensional heat flows at the edges of the heat conduction zone would still remain. However, a metal ring could be placed around the ice block and cooled to a temperature of 0 °C. In this way, the two-dimensional heat flow would be shifted close to the metal ring and provide an almost one-dimensional heat flow within the actual measuring zone.
Such a temperature-controlled ring, which guides the heat flow in a one-dimensional direction, is also known as a guard ring ( guard for short). This principle of a guided heat flow is used, for example, in the so-called Guarded-Hot-Plate Method (GHP) , which is described in more detail in the linked article.
RELATED ARTICLES MORE FROM AUTHOR

Cooling drinks with ice cubes (Derivation and calculation with formula)

Why does water boil faster at high altitudes?

Difference between latent heat of vaporization and enthalpy of vaporization

Vineyard Frost Protection (sprinkling with water)

Why steam burns are more dangerous than water burns?

Why does water extinguish fire?
- Legal notice
- Privacy Policy
Learning Materials
- Business Studies
- Combined Science
- Computer Science
- Engineering
- English Literature
- Environmental Science
- Human Geography
- Macroeconomics
- Microeconomics
- Thermal Conductivity of Metals
Explore the intricacies of thermal conductivity in metals , from basic understanding to advanced experimental approaches. This comprehensive guide delves into the fundamental aspects of thermal conductivity of metals , the factors that influence it, and how it contrasts with electrical conductivity. You'll gain insight into practical exploration through the metal rod experiment, and comparisons between thermal conductivity in metals and non-metals. Moreover, equip yourself with the skills to decode a thermal conductivity of metals chart, and gain detailed understanding on the thermal conductivity in liquid metals. This resource offers a thorough grasp on this core engineering concept, invaluable for anyone keen on mastering the nuances of thermal properties of materials.
Millions of flashcards designed to help you ace your studies
- Cell Biology
What are the key findings expected from the 'thermal conductivity of metal rod' experiment?
What is thermal conductivity and why is it high in metals?
What are some factors that significantly influence the thermal conductivity of metals?
What are the common factors affecting both thermal and electrical conductivity in metals?
What is the difference between thermal and electrical conductivity in metals in terms of the carriers of energy?
What is the 'Thermal Conductivity of Metals Chart' used for?
What is the primary aim of the 'thermal conductivity of metal rod' experiment?
What is thermal conductivity and how does it vary between metals and non-metals?
What are some notable exceptions to the expected thermal conductivities of metals and non-metals?
What factors influence the thermal conductivity of metals?
What phenomenon occurs to the thermal conductivity of metals when they transition from a solid to a liquid state?
Need help? Meet our AI Assistant

Need help with Thermal Conductivity of Metals? Ask our AI Assistant

Review generated flashcards
to start learning or create your own AI flashcards
Start learning or create your own AI flashcards

StudySmarter Editorial Team
Team Thermal Conductivity of Metals Teachers
- 20 minutes reading time
- Checked by StudySmarter Editorial Team
- Aerospace Engineering
- Artificial Intelligence & Engineering
- Automotive Engineering
- Chemical Engineering
- Design Engineering
- Design and Technology
- Engineering Fluid Mechanics
- Engineering Mathematics
- Engineering Thermodynamics
- Materials Engineering
- Aluminum Alloy
- Anodic Cathodic Reaction
- Antiferromagnetic Materials
- Applications of Ceramics
- Applications of Composite Materials
- Bituminous Materials
- Brick and Block Construction
- Brittle Fracture
- Bulk Metallic Glasses
- Carbon Footprint of Materials
- Carbon Steels
- Cellular Solids
- Cement and Concrete
- Ceramic Materials
- Classes of Polymers
- Composite Classes
- Composite Manufacturing Methods
- Composite Material
- Composite Theory
- Concrete Manufacturing
- Conductivity of Metals
- Corrosion Protection
- Creep Rupture
- Creep in Materials
- Creep in Metals
- Crystalline Lattice Structure
- Crystalline Solids
- Deviatoric Stress
- Diamagnetism
- Diffusion Creep
- Diffusion in Materials
- Dislocations
- Dry Corrosion
- Ductile Fracture
- Effect of Temperature on Materials
- Effects of Grain Size
- Elastic Deformation in Materials
- Elasticity of Materials
- Electrical Properties of Materials
- Environmental Impact of Materials
- Factor of Safety
- Fatigue Chart
- Fatigue Crack Initiation
- Fatigue Material
- Ferrimagnetic Materials
- Ferroelectricity
- Ferromagnetic Materials
- Ferrous Alloys
- Fracture Temperature
- Fracture Toughness
- Fracture in Materials
- Fretting Corrosion
- Galvanic Corrosion
- Glass Ceramics
- Glass Material
- Glass Microstructure
- Glass Transition Temperature
- Grain Growth
- Grain Size Strengthening
- Hall Effect
- Hardness Testing
- Heat Treatment
- High Cycle Fatigue
- High Temperature Ceramics
- High Temperature Materials
- Homologous Temperature
- Hydrostatic Stress
- Imperfections in Solids
- Interatomic Bonding
- Isotropic Hardening
- Kinematic Hardening
- Light Alloys
- Lightweight Material
- Linear Elastic Fracture Mechanics
- Low Cycle Fatigue
- Magnesium Alloys
- Magnetic Materials In Engineering
- Material Deformation
- Material Failure
- Material Index
- Material Safety Data Sheet
- Materials Fundamentals
- Materials Selection
- Mean Stress
- Metal Joining
- Microstructure of Ceramics
- Microstructure of Metals
- Molecular Weight
- Necking Engineering
- Nickel Alloys
- Non Ferrous Alloys
- Oxidation and Corrosion
- Paramagnetic Materials
- Paris' Law
- Phase Diagram
- Phase Transformations
- Piezoelectricity
- Plastic Deformation
- Polymer Crosslinking
- Polymer Material
- Polymer Matrix Composites
- Polymer Structures
- Polymerization
- Precipitation Hardening
- Properties of Composite Materials
- Properties of Concrete
- Recovery Stage of Annealing
- Recrystallization
- Semiconductors
- Solid Solution Hardening
- Solid Solution Strengthening
- Solidification
- Specialist Materials
- Spring Dashpot Model
- Stages of Creep
- Strengthening of Metals
- Stress Concentration
- Stress Corrosion Cracking
- Stress Strain Curve
- Stress and Strain
- Superconductors
- Temperature Dependent Properties
- Tensile Properties
- Tensile Testing
- Thermoplastic
- Timber Degradation
- Timber Properties
- Titanium Alloy
- Toughening of Glass
- True Stress and Strain
- Types of Materials
- Uniaxial Loading
- Viscoelasticity
- Von Mises and Tresca Criteria
- Wet Corrosion
- Work Hardening
- n type Semiconductor
- p type Semiconductor
- Mechanical Engineering
- Professional Engineering
- Robotics Engineering
- Solid Mechanics
- What is Engineering
Jump to a key chapter
The Fundamental Understanding of Thermal Conductivity of Metals
Thermal conductivity, a key concept in engineering properties, refers to the intrinsic ability of a material to convey heat through it. For metals , this property is uniquely robust due to the presence of mobile or 'free' electrons that facilitate efficient thermal energy transport.
What is the Thermal Conductivity of Metals?
The thermal conductivity of metals refers to the transmission rate of thermal energy through a metal. It is primarily due to free or delocalized electrons in the metallic crystal lattice structure, which serve as the carriers of energy.
Thermal Conductivity: A property of a substance that quantifies the rate of heat energy transfer within it, commonly denoted by the Greek letter \( \kappa \) or \( \lambda \), and is measured in Watts per metre Kelvin (W/mK) in SI units.
Furthermore, due to factors like varying electron density, configuration, and bonding, thermal conductivity can significantly change from one metal to another. Take, for instance, silver- the metal with the highest thermal conductivity, and lead- a metal with relatively low conductivity.

Factors Influencing the Thermal Conductivity of Metals
It's important to consider several influencing factors that affect the thermal conductivity of metals. One primary factor is temperature: as temperature increases, the thermal conductivity of most metals tends to decrease.
This phenomenon occurs due to increased lattice vibrations within the metal's atomic structure at higher temperatures, leading to frequent scattering of heat-carrying electrons- effectively slowing down their movement and resulting in decreased thermal conductivity.
- Impurities: Even a small amount of impurity in a pure metal can significantly reduce its thermal conductivity. This happens because impurities interfere with the uniform vibrations of atoms- causing electron scattering that reduces conductivity.
- Crystal Structure: The way atoms are arranged in a metal can impact how heat flows through it. Metals with a densely packed crystal lattice generally have higher thermal conductivity.
It's noteworthy that factors like pressure and magnetic fields also impact a metal's thermal conductivity to some extent, although not as significantly as temperature and impurities.
For example, under extreme high pressures, metals can undergo phase transition- altering their lattice structure and subsequently, thermal conductivity. Likewise, in presence of strong magnetic fields, changes in electron movement can affect thermal energy transfer.
Understanding the influencing factors in depth allows engineers to manipulate thermal conductivity as per requirement, making this knowledge integral to various practical applications such as designing radiators, heat exchangers, and electronic devices.
Contrasting Thermal and Electrical Conductivity of Metals
Thermal and electrical conductivities are fundamental properties that define metals, each pertaining to the transfer of a different form of energy. Understanding the contrast between these two forms of conductivity forms a basis for various engineering applications.
Common Factors Affecting Thermal and Electrical Conductivity
Quite fascinatingly, many factors influence both thermal conductivity and electrical conductivity in similar ways. Essentially, these factors either obstruct or facilitate the transfer of energy within a metal.
- Temperature: With a rise in temperature, thermal vibrations of the atom increase, which inevitably increase the scattering of electrons. This intensification of scattering restricts electric flow (thus reducing electrical conductivity) and similarly disrupts thermal energy transfer (reducing thermal conductivity).
- Structural defects and impurities: Any deviations from a metal's perfect crystal lattice, including impurities and defects, can create scattering centers for both thermal and electric charge carriers, thereby reducing both conductivities.
- Crystal structure: The arrangement of atoms in a metal governs the movement of free electrons and phonons, which in turn regulates both thermal and electrical conductivity.
When engineers understand these common influencing factors, they can manipulate certain conditions to optimize both thermal and electrical conductivity for specific applications.
Phonons: They are quantized modes of vibration occurring in a rigid crystal lattice, like the atomic lattice of a solid. The energy they carry is responsible for the transmission of heat within a solid.
Scattering refers to the process where free electrons, being the charge carriers in a metal, bump into these imperfections and are deflected from their path. This disruption in their movement impacts the efficiency of thermal and electrical energy transfer.
Differentiating Thermal and Electric Conductivity in Metals
While thermal and electrical conductivity share several influencing factors and underlying principles, they also reveal stark differences.
- Carrier of energy: In the context of electrical conductivity, the 'free' or delocalized electrons act as the primary carriers of electric energy. These electrons move under the influence of an applied electric field, forming an electric current. However, in the case of thermal conductivity, thermal energy is primarily carried by both these 'free' electrons and quantized lattice vibrations termed as "phonons".
- Interdependence: Electrical conductivity is independent of thermal conductivity in insulators and semiconductors. However, in metals, a relatively strong correlation exists, popularly expressed as the Wiedemann-Franz Law. This law establishes a proportional relationship between the thermal conductivity \(\kappa\) and the electrical conductivity \(\sigma\) of a metal, given by:
Where \(L\) is the proportionality constant known as the Lorenz number, and \(T\) is the absolute temperature. The Wiedemann-Franz law, however, does not hold true when strong magnetic fields or extremely low temperatures are involved.
For example, consider silver, a metal with very high electrical conductivity. Following the Wiedemann-Franz law, it also presents superior thermal conductivity. However, a metal like manganese, operating under a strong magnetic field, does not adhere to the law- reflecting poor thermal conductivity despite reasonable electrical conductivity.
Understanding the commonalities and differences between these two conductivities aids in designing and selecting suitable materials for applications like large-scale power transmission or thermal management in electronic devices.
Exploring the Thermal Conductivity of Metal Rod Experiment
The experiment involving a metal rod is a popular simulation in physics and materials science labs to aid students understand the concept of thermal conductivity practically. It serves as a hands-on exercise to delineate how thermal energy transfers in solids and how different metals vary in their conductivity.
Procedure and Objectives of the Metal Rod Experiment
The procedure to carry out a 'thermal conductivity of metal rod' experiment is systematically designed to offer a complete understanding of thermal conductivity in metals. It begins with a setup of similar-shaped rods made of distinct metals, usually aluminium, copper, and steel. One end of these rods is heated uniformly while the other end is left to cool at normal room temperature. With time, and as heat travels across the rod, the changes in temperature along the rod are tabulated at regular intervals.
The primary objective of this experiment is:
- Understanding the theory of thermal conductivity in a practical setup.
- Determining the thermal conductivities of different metals.
- Observing the variation of temperature along the length of the rod with time.
The speed at which temperature changes along the rod is directly related to the thermal conductivity of the rod's metal. The faster the temperature changes, the higher the thermal conductivity of the metal.
This experiment provides an invaluable visualisation of how heat distributes in a conducting rod and encourages an appreciation of the temperature gradient within the rod, which is a key factor in determining thermal conductivity.
Expected Results and Key Findings with Metal Rod Experiment
Once the setup is heated and the tracking begins, a pattern will start to emerge in the recorded data. You will notice the temperature at different positions on each rod gradually increasing, displaying a temperature gradient along its length. This temperature gradient will appear more substantial in rods made of metals with higher thermal conductivity.
The fundamental findings expected from this experiment are:
- Metals with higher thermal conductivity like copper and aluminium will show a faster rate of temperature change as compared to metals with lower thermal conductivity like steel.
- A steady temperature gradient is established with time across each metal rod, with the hot end displaying the highest temperature and gradually decreasing towards the cooler end.
- Over time, each rod tends towards a uniform temperature, indicating the steady-state condition of heat transfer.
For instance, after a certain heating time, it might be observed that the aluminium and copper rods are distributing the heat more evenly across their length, due to their higher thermal conductivities. In contrast, similar temperature changes aren't as apparent in the steel rod because steel’s thermal conductivity is lower.
These observations resonate with the underlying theoretical concepts of thermal conductivity and provide a solid platform for understanding its real-world applications.
Remember, this experiment captures the essence of the thermal conductivity of metals. The key findings allow you to appreciate the heat transfer mechanisms in solids, a critical aspect of thermal physics and its engineering applications.
Delineating Thermal Conductivity of Non-Metals and Metals
Thermal conductivity, the inherent property of a material to conduct heat, is a crucial aspect to understand in materials science and physics. Notably, this property varies significantly between metals and non-metals, providing an opportunity for comparison.
Comparing the Thermal Conductivity of Metals and Non-Metals
When comparing the thermal conductivities of metals and non-metals, the most noticeable difference is the magnitude. Metals, typified by their free electron cloud, usually possess high thermal conductivities. For example, silver and copper are especially known for this distinctive feature, boasting thermal conductivities of 429 (W/mK) and 401 (W/mK) respectively. This conspicuous ability to conduct heat arises from the prevalent free electron model in metals where "free" or delocalized electrons carry most of the thermal energy across the metal lattice.
In contrast, non-metals typically showcase a markedly lower thermal conductivity. This reduction can be attributed to their distinct atomic structure, where tightly bound electrons limit energy transfer. For instance, irrespective of its wide availability and adaptability, wood, a substantial non-metal, has an exceedingly low thermal conductivity, roughly 0.04 to 0.12 (W/mK). Additionally, it's worth noting the classical "heat insulator", glass, another non-metal, also carries a low thermal conductivity, approximately 0.8 (W/mK).
Despite these figures, it's essential to moderate our perspective about non-metals. While it's conventional to simply think of non-metals as "poor conductors ", specific instances challenge this stereotype.
- Diamond, a non-metal, astoundingly possesses one of the highest known thermal conductivities, approximating 2000 (W/mK) at room temperature!
Thermal conductivity is measured in units of Watts per metre per kelvin (W/mK). This unit measures how well a one-metre cross-section of a particular material, while maintaining a one-degree Kelvin temperature gradient across its structure, conducts heat.
Instances of Thermal Conductivity in Non-Metals
Once you observe outside the conventional realm of non-metal elements, numerous surprises lie in store. Noteworthy examples are synthetic non-metal materials like polymers and certain ceramics which can be designed to exhibit greater thermal conductivity. The principal mechanism for heat transfer here is not electron movement (as in metals), but the propagation of lattice vibrations, known as "phonons".
Polymers, an extensive family of non-metals, embrace an ocean of applications, eventually stretching to aerospace engineering and super-computing. These polymers, under specialised engineering processes, can reflect healthy thermal conductivities in the range of 20 to 50 (W/mK). Considering the inherent low density, mechanical flexibility and resistance to electricity, these figures are quite astonishing.
Additionally, certain engineered ceramics (non-metals), such as aluminium nitride and boron nitride, gain the attention of researchers. Aluminium nitride presents a thermal conductivity upto 320 (W/mK), while that of boron nitride can even exceed 400 (W/mK). These figures rival the conductivities of some metals!
The hallmark of these non-metals is the engineering potential they hold. By manipulating their structure and composition, they can be customised to portray enhanced thermal conductivity, delivering a boost to their application potential.
Liquid Crystal Polymers (LCPs) are a peculiar group of polymers that can be oriented in a specific direction during fabrication. Post solidification , they maintain this orientation, enabling high thermal conductivity paths along their length. This engineered pathway invites phonons to travel longitudinally, resulting in LCPs demonstrating thermal conductivities beyond 40 (W/mK). Far from their polymer brethren, isn't it?
Here is a compiled list of several metals, non-metals, and some specially engineered materials, accompanied by their respective thermal conductivities:
As you delve deeper into the realm of thermal conductivity, you will discover that the landscape is not strictly binary. It's not just about 'high-conducting' metals and 'low-conducting' non-metals; it's a spectrum, punctuated with outliers and abnormals, each adding a sprinkle of fascination to thermal conductivity. Tread beyond conventions, and you will stumble upon a world of materials donning thermal conductivities that challenge stereotypes.
Analysing the Thermal Conductivity of Metals Chart
Within the field of engineering and materials science, you'll often find visual guides like the thermal conductivity of metals chart. This chart, typically in the form of a bar graph or a table, provides comprehensive data on the thermal conductivities of various metals. Clear interpretation of this data is critical as it aids in selecting suitable materials for diverse applications such as heat exchangers, heat sinks, and thermal insulators .
Understanding How to Use Thermal Conductivity of Metals Chart
The thermal conductivity of metals chart is a visual representation offering a comparison of thermal conductivity between various metal types. It conveys how well each metal conducts heat, attributed to the free flow of electrons present in its lattice structure. Every metal listed typically possesses a corresponding bar or a numeric value representing its thermal conductivity. This value is generally represented in watts per metre per kelvin (W/m·K).
Thermal Conductivity (k) is the material's intrinsic ability to transfer heat. It can be mathematically represented using the Fourier's law of thermal conduction:
- \( q \) is the heat flux (the amount of heat transferred per unit area per unit time),
- \( k \) is the thermal conductivity,
- \( \nabla T \) is the temperature gradient.
By perusing a thermal conductivity chart, you can determine which metals have the highest and lowest thermal conductivity. The metals are ranked based on their thermal conductivity, the metal with the highest thermal conductivity appearing at the top, descending to the metal with the lowest at the end.
For instance, silver is known to possess one of the highest thermal conductivities. Therefore, silver is featured prominently at the top of the chart. On the other hand, stainless steel, known for its relatively low thermal conductivity, would be towards the bottom. Precise use of these charts can guide you in selecting the metal most suited to meet your engineering requirements.
If you are engineering a heat sink, which needs to dissipate heat efficiently, you’d choose a metal from the top of the chart, like Copper or Aluminium, known for their high thermal conductivities. Alternatively, if you are designing a thermal insulator, low thermal conductivity matters most, guiding you towards metals like Stainless steel or Titanium.
Trends Presented in the Thermal Conductivity of Metals Chart
The thermal conductivity of metals chart not only provides a comparison between various metals but also hints at interesting trends. The most apparent aspect is the organization of metals based on their thermal conductivity values. From top to bottom, the chart mostly follows the order of decreasing thermal conductivity values, starting with extraordinary conductors like Silver and Copper and cascading down to meagre conductors like Stainless steel and Lead.
However, observing the chart critically, it becomes evident that thermal conductivity is not solely a function of the chemical identity of the metal - it also correlates with the grouping of the metal in the periodic table and its ambient state. For instance, metals belonging to the same group, such as alkali metals (Li, Na, K, etc.), exhibit close thermal conductivities. Similarly, similarly structured materials (face-centred cubic, body-centred cubic, etc.) reflect similar thermal conductivities.
Although there are exceptions, these trends attest to the interplay between atomic structure and electron mobility in the determination of a material's thermal conductivity.
Here are several metals and their corresponding thermal conductivities presented in a typical Thermal Conductivity of Metals chart:
By skirting through these units, you can build a foundational understanding of how different metals exhibit different conductive characteristics. And as you delve further into this realm, the Thermal Conductivity Chart of Metals can serve as a guiding compass, navigating you through the abundance of data and aiding your material selection processes.
Examining Thermal Conductivity of Liquid Metals
When discussing the thermal conductivity of metals, it's common to focus on their solid states. However, many applications require an understanding of these properties in the liquid state, such as in casting, welding, and cooling processes in nuclear reactors. Hence, thermal conductivity of liquid metals is a significant aspect in the broader context of thermal conductivity of metals.
An Overview of Thermal Conductivity in Liquid Metals
In liquid metals, the applicability of free-electron theory is limited due to the non-crystalline nature and greater randomness of atomic arrangement. In the liquid state, the thermal conductivity is found to decline markedly compared to their solid-state counterparts. This significant drop is attributed to the reduced electron mean free path in the absence of a well-ordered crystal lattice as seen in solid metals.
The free-electron theory is a simplified model that assumes metals consist of a uniform positive charge with free electrons distributed throughout. In this model, thermal conductivity is ascribed to the motion of these free electrons.
However, the liquid state brings about a collision-dominated regime due to increased atomic motion and randomness. It leads to a reduction in the average distance an electron can travel before colliding with another particle (electron mean free path), leading to lower thermal conductivity.
Let’s consider a metal like Sodium. In its solid state, Sodium holds a thermal conductivity of around 140 W/m·K. However, when melted into a liquid state, this conductivity level drops drastically to about 70 W/m·K, exhibiting the substantial disparities between a metal's solid and liquid thermal conductivity.
Despite this, compared to many other liquids, liquid metals still exhibit relatively high thermal conductivity due to the persisting mobility of free electrons. Therefore, they continue to be significant contributors in heat transfer applications that involve phase changes.
Irregularities and Special Cases in Liquid Metals Conductivity
While the overall reduction in thermal conductivity in liquid metals is a widely observed phenomenon, there are interesting irregularities and exceptions worth noting. Amidst these deviations, you'll see that not all liquid metals follow the expected trend of reduced conductivity in their liquid form. Some even show reversed behaviour where the liquid state holds higher thermal conductivity than its solid state.
One of these special cases includes the alkali metal, Cesium. Unlike most other metals, Cesium's liquid state has been discovered to have slightly higher thermal conductivity than its solid state, primarily due to its particular band structure and electron-phonon interaction characteristics.
Mercury is another unique case. As one of the few metals that exist as a liquid at room temperature, its thermal conductivity is far lower than what might be expected for a metal and closer to the values exhibited by high-density gases and certain organic liquids. This deviation results from Mercury’s unique electronic structure, where its filled d-shells limit the availability of free electrons for conducting heat.
- Cesium (Solid State) - 35.9 W/m·K
- Cesium (Liquid State) - 36.6 W/m·K
- Mercury - 8.3 W/m·K
These and other examples highlight the complex determination of thermal conductivity in liquid metals, shaped by the intricate interplay of electronic and atomic configurations. These intricacies and special cases underline the importance of precise understanding and application of thermal conductivity values, especially within the multifaceted domains of engineering and material sciences.
Thermal Conductivity of Metals - Key takeaways
- Thermal and electrical conductivity in metals have similarities and differences. Free electrons act as primary carriers of electric energy while thermal energy is carried by both free electrons and lattice vibrations known as phonons.
- The Wiedemann-Franz Law establishes a proportional relationship between thermal and electrical conductivity of a metal.
- Thermal conductivity of metals and non-metals vary significantly. Metals usually possess high thermal conductivities while non-metals have lower thermal conductivities due to their distinct atomic structures.
- The thermal conductivity of a metal rod experiment demonstrates how thermal energy transfers in solids and how different metals vary in conductivity.
- The thermal conductivity of metals chart provides comprehensive data on the thermal conductivities of various metals, helping in selecting suitable materials for different applications.
Flashcards in Thermal Conductivity of Metals 12
The experiment shows that metals with higher thermal conductivity like copper and aluminium have a faster temperature change, a steady temperature gradient is established in each metal rod over time, and each rod tends towards a uniform temperature (steady-state of heat transfer).
Thermal conductivity is the intrinsic ability of a material to conduct heat. In metals, this property is robust due to the presence of free or delocalized electrons in the metallic crystal lattice structure which serve as efficient carriers of thermal energy.
Primary factors influencing thermal conductivity of metals include temperature, impurities, and crystal structure. For instance, as temperature increases, thermal conductivity of metals tends to decrease. Impurities may interfere with uniform vibrations of atoms, and crystal structure can impact how heat flows through metals.
The common factors affecting both thermal and electrical conductivity in metals include temperature, structural defects and impurities, and the crystal structure. Temperature changes cause an increase in thermal vibrations and electron scattering, reducing both conductivities. Structural anomalies also create scattering centres, affecting conductivities. The crystal arrangement regulates the movement of free electrons and phonons, influencing both conductivities.
In terms of the carriers of energy, for electrical conductivity in metals, 'free' or delocalized electrons act as the primary carriers of electric energy. In contrast, for thermal conductivity, thermal energy is primarily carried by both these 'free' electrons and quantized lattice vibrations known as "phonons".
The 'Thermal Conductivity of Metals Chart' is used to compare different metals’ thermal conductivity, aiding in material selection for engineering applications needing heat conducting or insulating properties.

Learn with 12 Thermal Conductivity of Metals flashcards in the free StudySmarter app
We have 14,000 flashcards about Dynamic Landscapes.
Already have an account? Log in
Frequently Asked Questions about Thermal Conductivity of Metals
Test your knowledge with multiple choice flashcards.
What are the key findings expected from the 'thermal conductivity of metal rod' experiment?

Join the StudySmarter App and learn efficiently with millions of flashcards and more!
That was a fantastic start, you can do better, sign up to create your own flashcards.
Access over 700 million learning materials
Study more efficiently with flashcards
Get better grades with AI
Already have an account? Log in
Keep learning, you are doing great.
Discover learning materials with the free StudySmarter app

About StudySmarter
StudySmarter is a globally recognized educational technology company, offering a holistic learning platform designed for students of all ages and educational levels. Our platform provides learning support for a wide range of subjects, including STEM, Social Sciences, and Languages and also helps students to successfully master various tests and exams worldwide, such as GCSE, A Level, SAT, ACT, Abitur, and more. We offer an extensive library of learning materials, including interactive flashcards, comprehensive textbook solutions, and detailed explanations. The cutting-edge technology and tools we provide help students create their own learning materials. StudySmarter’s content is not only expert-verified but also regularly updated to ensure accuracy and relevance.
Team Engineering Teachers
Study anywhere. Anytime.Across all devices.
Create a free account to save this explanation..
Save explanations to your personalised space and access them anytime, anywhere!
By signing up, you agree to the Terms and Conditions and the Privacy Policy of StudySmarter.
Sign up to highlight and take notes. It’s 100% free.
Join over 22 million students in learning with our StudySmarter App
The first learning app that truly has everything you need to ace your exams in one place
- Flashcards & Quizzes
- AI Study Assistant
- Study Planner
- Smart Note-Taking


COMMENTS
Submitted By: AL-NAMLAH ID: 430102348 GROUP AEXPERIMENT PERFORMED ON 28/5/1434 H1 IntroductionIn this experiment it is required to evaluate the thermal conductivity of copper experimentally. nd the get the temperature distribution for constant and variable area copper bars.The transf. r of heat is normally from a high temperature object to a ...
Procedure. Fill a large container with water and ice cubes and allow the water to cool for an hour. Bend all the metal rods in half to develop metal bridges. Metal bridge experiment. Keep the cups in pairs, and the three bridges of the same metal exist between every cup. One pair of cup do not have bridges, and this is the control group.
In this article we will only focus on the experimental determination of thermal conductivity, which is based on the equation above: λ = Q˙ ⋅ Δx ΔT ⋅ A (2) (2) λ = Q ˙ ⋅ Δ x Δ T ⋅ A. In order to determine the thermal conductivity λ of a material with a thickness Δx and an area A, a temperature difference ΔT must first be ...
The generalized heat conduction equation for constant thermal conductivity in Cartesian co-ordinate is: 2 2 2 1. 2 + + +. 2 =. 2. T = temperature distribution at the location x,y,z ( oC) x,y,z = co-ordinates. q = internal heat generation rate per unit volume (W/m^3) k = thermal conductivity of the material (W/mK)
1.THERMAL CONDUCTIVITY OF A METAL ROD AIM OF THE EXPERIMENT: a) To measure the temperature gradient along the length of the metal (copper) rod. b) To determine the co-efficient of thermal conductivity of the metal (copper). INTRODUCTION: Conduction is a process of heat transfer through solids. When a
(iii) To determine thermal conductivity of the metal specimen. Experimental Set up: Operation procedure 1. Check the room temperature by an analog thermometer and then calibrate the digital thermocouples. 2. Start the experiment by switching on the Veriac and make suitable heating at the end of the brass bar by nicrome wire. 3.
Explore the intricacies of thermal conductivity in metals, from basic understanding to advanced experimental approaches.This comprehensive guide delves into the fundamental aspects of thermal conductivity of metals, the factors that influence it, and how it contrasts with electrical conductivity.You'll gain insight into practical exploration through the metal rod experiment, and comparisons ...
Thermal conductivity can be measured using standard methods, devices and techniques. In this experiment, we will measure thermal conductivity of a metal, and in addition, calculate an overall heat transfer coefficient for three metals in series. THEORY In this experiment we will investigate conduction in an insulated long slender brass bar
Calculate the value of K using equation (1) given above. Results: 1.The Thermal conductivity K of Copper obtained experimentally = cal/gm./ oC/sec 2.The standard value of Thermal conductivity K of Copper = 0.918 cal/gm./ oC/sec The experimentally observed value of K is always with in + 10% on the standard value Precautions:
Description. Principle. The thermal conductivity of copper and aluminium is determined in a constant temperature gradient from the calorimetrically measured heat flow. Benefits. Easy to set temperature gradient. Compact, easily transportable setup. Tasks. Determine the heat capacity of the calorimeter in a mixture experiment as a preliminary ...